If you turn on CNBC you’ll probably see and hear a bunch of talking heads screaming about how many points the Dow is up on the day or where the S&P 500 is heading. It can be a lot to take in and even we learn new things about the major indexes from time to time. So if you are confused about what these things represent you’re in the right place.
The major indexes include the Dow Jones Industrial Average, Standard & Poors 500 (S&P 500), and the NASDAQ Composite. There are countless more you may have heard of like the Russell 2000, but usually the three listed above are the most talked about and usually can be used to get a quick snapshot of whats happening in the market.
The Dow Jones Industrial Average
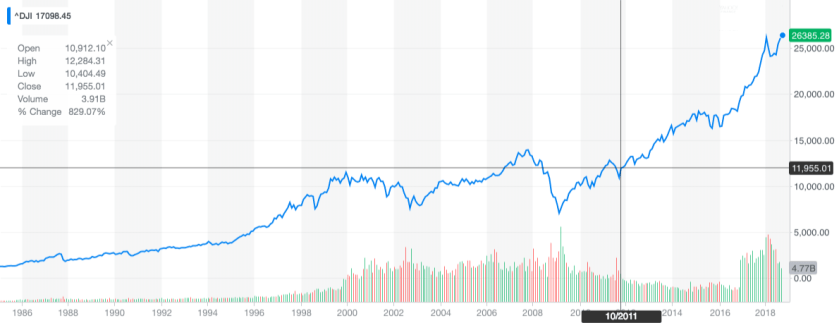 The Dow traces its roots back to 1885 and was officially introduced in 1896 when Charles Dow calculated an average of 12 purely industrial stocks. Surprisingly, it is not the oldest index as it is 12 years younger than the Dow Transportation Average. It has come a long way since then and now holds 30 stocks with none of the original 12 remaining. GE has the record for the longest Dow membership, but was recently removed for Walgreens amidst a series of financial blunders. The companies are selected by a committee of experts with the goal being to select companies that together best represent the US economy as a whole rather than purely industrials for which it was originally intended.
The Dow is the most followed US index. Whenever it passes a mile stone celebrations are in order and whenever there is a crisis people gauge the severity by how much the Dow has fallen. Interestingly enough the index is price weighted. This means that a company that has a greater price per share represents a larger portion of the Dow than a company with a lower price per share.
A table of all the components can be found here.
The Standard & Poor’s 500
 Started in 1957, the S&P 500 is a weighted average of the top 500 stocks in the US by market cap. Unlike the price weight of the Dow the S&P 500 is cap weighted meaning that companies with a larger market capitalization represent a larger portion of the index. For example, a price swing in Amazon would have a bigger effect on the index than a price swing in Campbell’s Soup.
This index is just as popular as the Dow and some might argue that it gives a more holistic view of the US economy since it is an average of more stocks. Since its construction relies solely on market cap it does tilt toward certain sectors of the economy and individual companies. Currently the S&P 500 tilts toward the technology and financial services sector with about 26% and 15% weighting respectively. The smallest sector is telecom at just under 2% (I calculated these a few months ago so I apologize if they are not 100% accurate). To take this a step further about 4% of the index is AAPL while smaller companies can be just fractions of a percent of the index. Overall, the S&P 500 is a solid way to hold the US market, but its construction can sometimes cause it to lean towards what’s hot. We are working on an article discussing this in more detail and hope to share it soon.
To see the full list of member companies click here.
The NASDAQ Composite
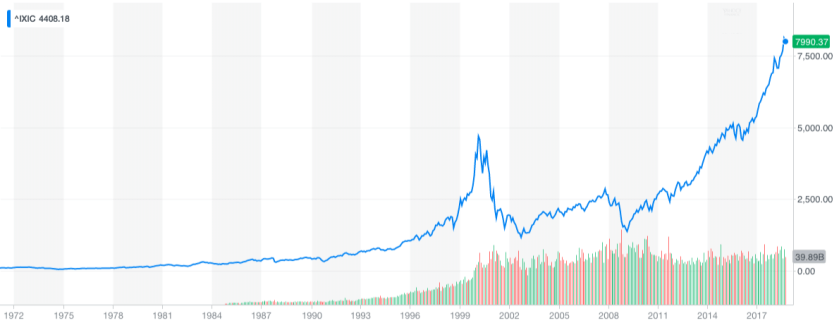 The NASDAQ composite is a composite index of all stocks trading on the NASDAQ exchange. If you haven’t heard of the NASDAQ exchange it’s simply a separate stock exchange from the NYSE set up in the 1970s as the first electronic exchange. To put this in simple terms every trade on the NYSE gets cleared in New York at the NYSE. The NASDAQ is different as it allows sellers to automatically connect to buyers in a decentralized manner. For further details click here for an interesting Investopedia article on how it all works.
Although it is not a tech exclusive index the NASDAQ is notorious for being technology heavy. The index dropped over 80% in value in the early 2000s dot com bubble. As of May the index sits at about 46% technology stocks, but otherwise has a good mix of stocks from every sector. Additionally, it is also market cap weighted like the S&P meaning larger market caps represent a larger portion of the index. It differs from the S&P 500 in that any company that chooses to list on the NASDAQ exchange is automatically on the index whereas the S&P 500 is the top 500 companies by market cap that are based in the US regardless of exchange. Over 2600 stocks trade on the NASDAQ and they are all represented in the NASDAQ Composite index although some fund managers might select the top 100 as it makes it easier to package into index funds and the like.
For the full list of companies click here.
The Bottom Line
The major indices do a great job of giving a snapshot of the US markets, but that’s about it. The construction of these indices show inherent biases towards industries and even individual companies. Owning the US markets has rewarded investors handsomely over the course of modern history, but it is important to know how indexes and funds are constructed so you can truly understand your investments.
The main takeaway here is to understand what your risks are. I have no problem with index investing as it is easier for me to justify why a whole market may go up than try to place a value on an individual security. If we can assess our risks and better understand our portfolios we can start thinking about if we want to hedge that risk out and at the very least we can understand why our portfolio is moving up or down to avoid rash uninformed decisions.
If you are interested in index investing some great funds and ETFs are offered by Vanguard and State Street. They are extremely passive, have very low fees, and minimal tracking error to the indexes they follow. As always it is important to read the funds prospectus and understand how it works before investing.
As always we welcome questions, comments, and thoughts at founders@themodernpiggybank.com. Be sure to subscribe to this website and follow us on twitter @themodernpiggy2.